
Array Probabilistic Results Window
This window provides an analysis of array results for each separate period. It is divided in two areas:
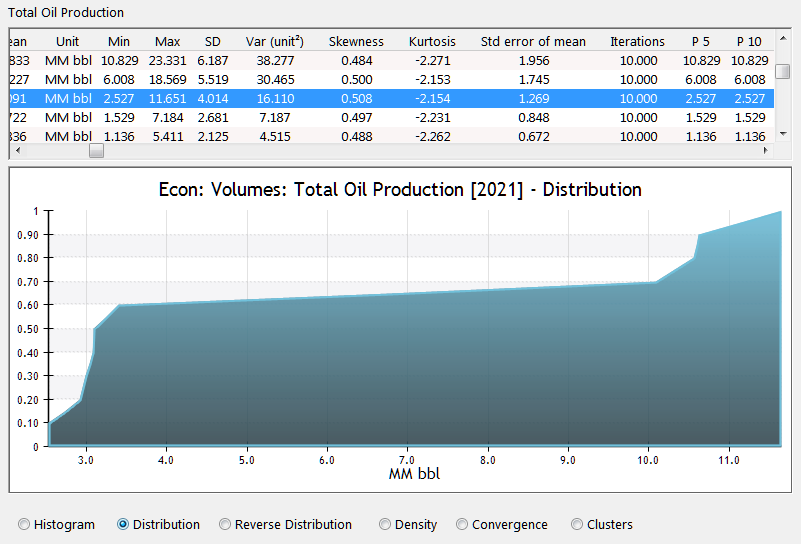
- The table on the top shows measures of the variable distribution for each period: Mean, Minimum, Maximum, Standard Deviation (SD), Variance (Var(unit^2)), Skewness, Kurtosis, Standard error of mean, Iterations and P5, P10, ... P100.
- The graph below plots the single value for the period selected in the table. The available options are those of the
- Single Probabilistic Results Window
Click image to expand or minimize.